
myFreeMonitor.com

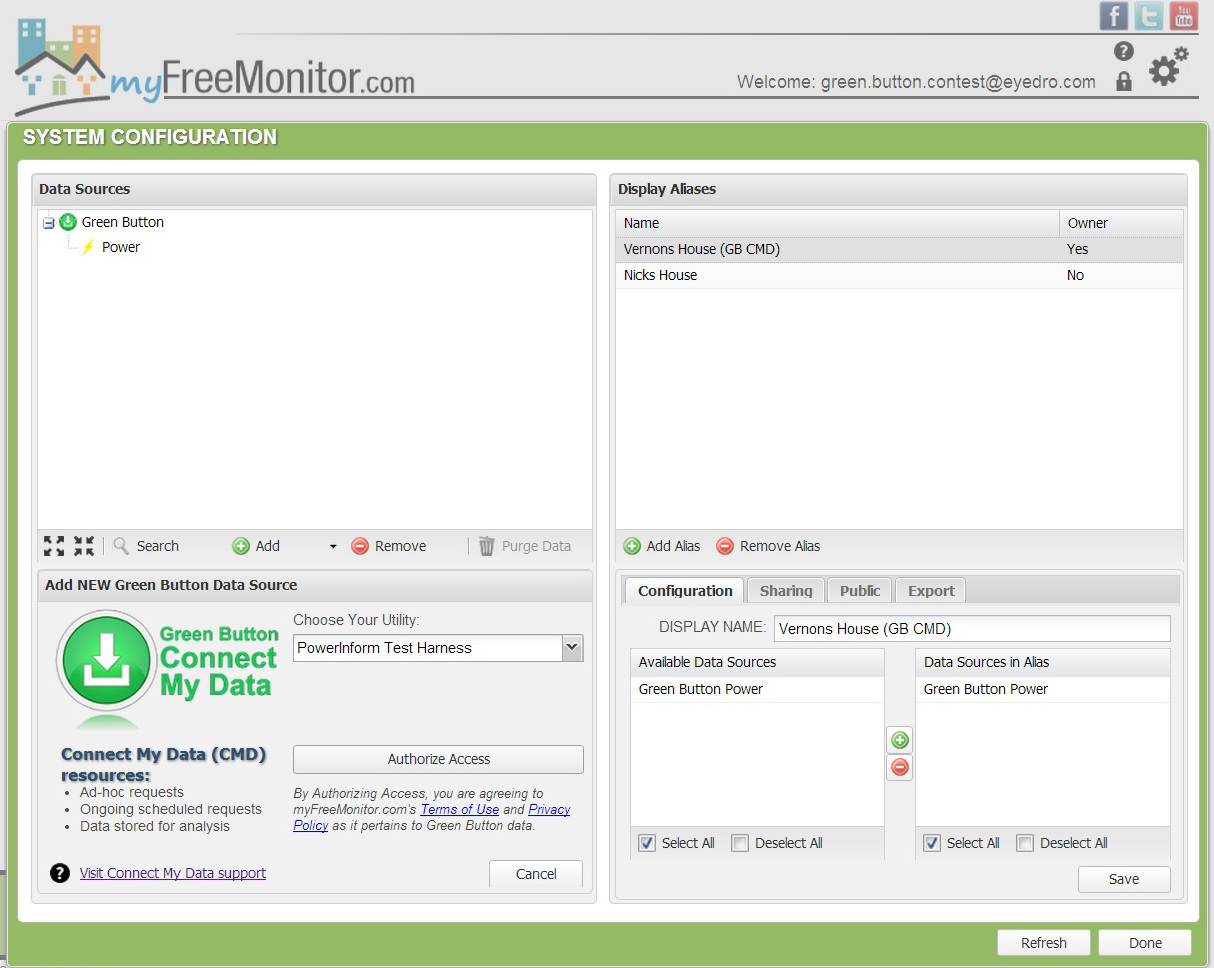


The myFreeMonitor.com electricity monitoring cloud service provides home owners and building managers with real-time energy usage and costs via an Eyedro or BlueLine electricity monitor. Now with support for Ontario Green Button Connect My Data, myFreeMonitor.com allows home owners to see what all the hype is about… at no cost. It only takes a few minutes to setup, and you’ll immediately begin understanding the mystery behind your electricity bill. Most users find their first energy and cost savings within days.
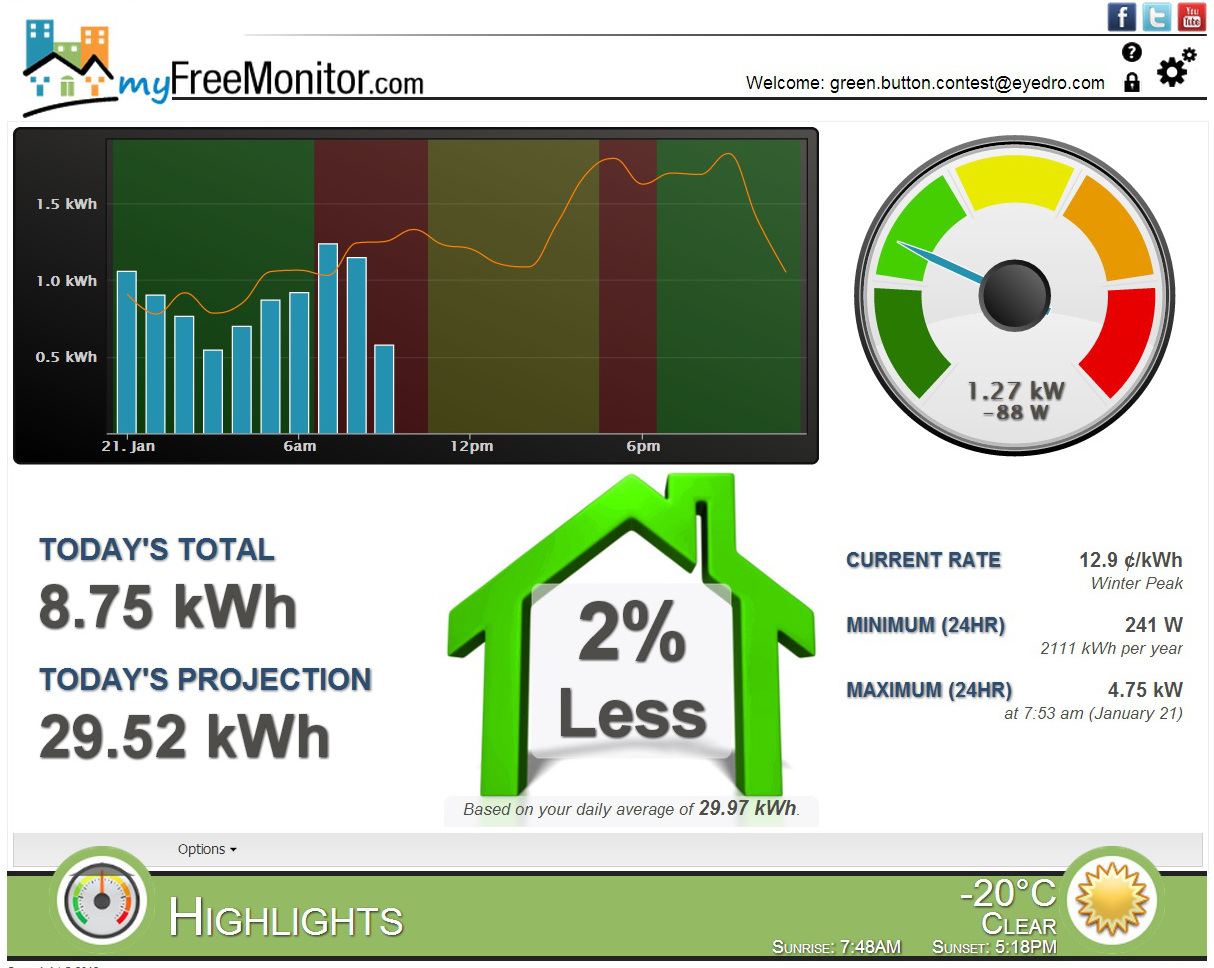
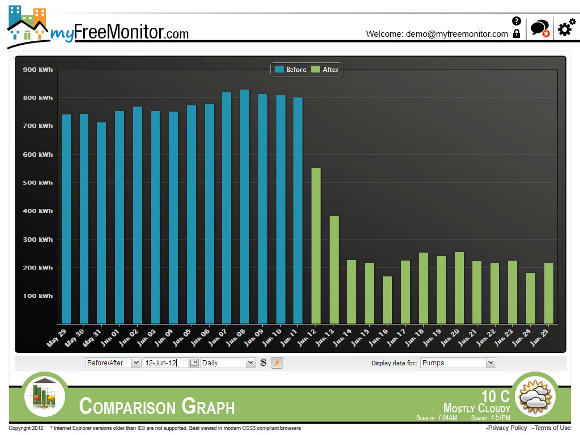
Features of the myFreeMonitor.com cloud service include: • Highlights/Dashboard – See key information about how much energy you’re consuming and what it’s costing now, with a colour coded house, building, or even your own custom image to show how successful your energy saving efforts are today. Some business owners show this view in their lobby as part of their social responsibility program. • Summary – See a full historical timeline of energy usage and costs in increments of 15 minutes, 30 minutes, 1 hour, 1 day, 1 week, or 1 month increments. • Comparison – This feature is great for comparing the energy usage and cost of one building vs. another building, one tenant vs. another, or even one appliance vs. another at any point in time. Some users find this useful for comparing similar equipment such as roof top air conditioners to help identify anomalies. The Comparison feature has a second option called ‘Before and After’ that is perfect for showing the benefits of energy saving projects, or key events. Eg. A home owner that would like to see the energy savings after installing new appliances, or an industrial facility that wants to show savings of maintenance activities on their equipment. • Bills and Rates – myFreeMonitor.com is fully configurable for different rate models (eg. time-of-use, fixed, tiered), seasons, and ‘extra’ bill fees. The Bill estimate feature shows a history of all bill periods with a break-down of peak, mid-peak, and non-peak usage, plus extra fees such as distribution, rebate, tax, etc. Users can see their estimated electricity bill up to the second. • Phantom Energy (aka Vampire Energy) – The Phantom Energy feature helps home owners understand how much actual energy and cost they are consuming 24 hours a day, an excellent indicator of phantom energy. With the Phantom Energy tool, users are able to drive energy saving changes that help reduce their electricity bill. • What’s It Cost – The What’s It Cost plug-in helps home owners estimate the cost of operation of specific appliances in their home. For example, many customers are surprised to learn that an aquarium can often be responsible for 10% of their electricity bill. • Live and Mobile – The Live feature provides real-time usage and costs when used with a supported real-time electricity monitor. This feature is extremely useful due to the 1 second resolution and immediate feedback. Having access to the same live data from any mobile device takes the experience to the next level. Green Button data is very useful and a critical first step, but real-time data is definitely an exciting upgrade. • Social/Sharing – Users can now share a public URL with friends and family to show off their success in reducing electricity costs, and in turn helping the environment. Another application of this feature is a school that shares the dashboard with students and teachers. • Additional features include exporting, and alerts, with reports and many other features to come.
Please see our video at https://green-button-contest.myfreemonitor.com/myFreeMonitorWithGreenButton-100q.mp4 (or lower resolution at http://youtu.be/ZGAJjrIMLVE), and contact Trevor Orton (torton@eyedro.com) for additional information.
8 comments
GEWATT • over 12 years ago
Excellent interface design which has been proven in web based system.
Trevor Orton • over 12 years ago
Thank you for the kind words GEWATT. We're very happy with how the myFreeMonitor interface has evolved and appreciate you taking the time to share your comments.
Trevor
DaveWaterloo • over 12 years ago
Just watched all the videos and it appears yours is the most complete project...
- didn't see real time usage anywhere else
- liked the projections
- think you always display costs ($$$) as consumers do not know watts as well as they know $
Good luck.
thowells • over 12 years ago
Good Luck
Trevor Orton • over 12 years ago
Thank you DaveWaterloo.
We believe Green Button is an important next step toward greater energy awareness and conservation in Ontario, and we look forward to helping grow Green Button adoption.
Real-time energy usage and costs simply takes the experience to the next level. The myFreeMonitor solution supports both Green Button users (ie. smart meter data) and those with a real-time electricity monitor (eg. Eyedro Home, Eyedro Business, or the Blue Line PowerCost Monitor, with others on the way).
Agreed, many consumers prefer to see electricity usage in cost vs kWh, especially with time-of-use (TOU) pricing. Moving usage from peak to off-peak times helps our smart grid almost as much as reducing the usage completely.
Thanks again. We appreciate your support!
Trevor
contact@myfreemonitor.com
jknowles • over 12 years ago
Good luck to Nick, Trevor, and the Eyedro team! You guys make a great product and provide a great service. Looking forward to seeing many more Eyedro's out in the field!
peteranz • over 12 years ago
Excellent product Trevor.
Trevor Orton • over 12 years ago
Thanks for the comments and votes! We appreciate your support.
Trevor
contact@myfreemonitor.com